
Nowadays, it’s a given that data drives professional decision-making. So, it’s essential for those working in the CPS field to be aware of and have access to reliable data sources. Important activities, including budgeting, program planning, fundraising, research, and advocacy, all benefit from using relevant data.
The reasons CPSTs and CPS programs need data often fall into the following three categories. Data can help define:
- The problem (e.g., crash data on child fatalities and injuries).
- The solution (e.g., data on availability of CPSTs, coalitions, and other programs).
- The progress (e.g., data on CR use and misuse).
Knowing where to get data in each of these categories is essential, and this article will highlight some national resources. CPSTs should stay on the lookout, as new offerings, like electronic reports and data dashboards, pop up regularly these days. Can’t find the data required? Ask a state highway office and/or CPS coordinator for assistance, especially for state or local data.
And, of course, any type of data is more useful if supplied in a format that is accessible and user-friendly. If CPSTs find a data source falls short on these qualities, it’s reasonable to encourage the data collector to provide it in a more useful format. These days, technology makes it possible to supply information to the public far more easily, quickly, affordably, and intelligibly than in the past.
Here are a few examples of some relatively new national data sources that CPSTs should know about.
Data about the problem
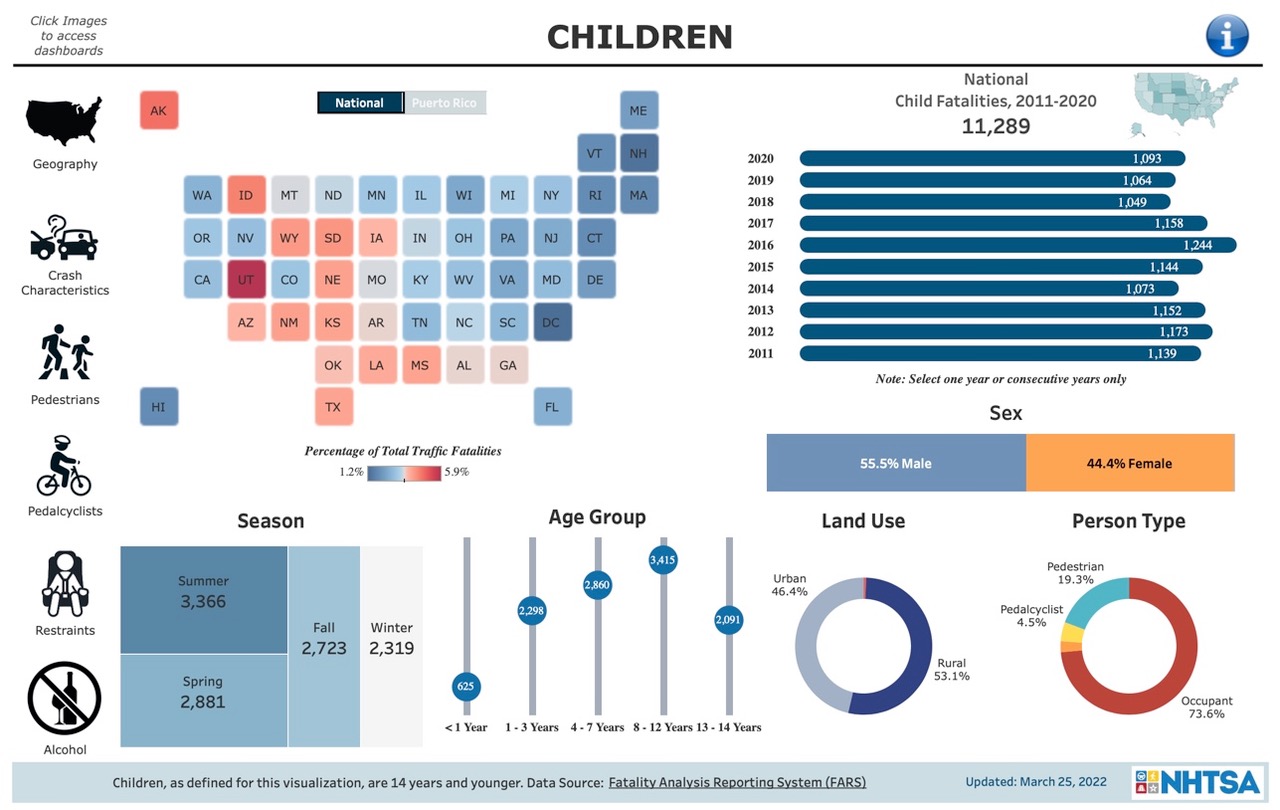
The CPS field exists to address the problem that children die or are injured in motor vehicle crashes, so a key data source about the problem is the Fatal Accident Reporting System (FARS). FARS is a NHTSA-instituted census of all fatalities on U.S. roadways that has been operational for decades. However, a recent addition is a series of dashboards posted here (select Fatality Motor Vehicle Crash Data Visualization). The dashboards present key aspects of FARS data visually, making it much easier for the public to find and use the information.
Selecting “Children” brings up a dashboard with multiple subpages about child fatalities (see image). The data includes not only the number of fatalities, but also important details like age ranges, the season of the crash, and urban vs. rural location.
To see a subpage on child restraints, click on the “Restraints” icon on the left-hand side. That page has details about car seat use in fatal crashes, including restraint type and whether or not the driver was buckled up. Other subpages cover crash characteristics, pedestrians, pedalcyclists, alcohol involvement, and geographical location.
National data is shown by default, but state or even regional information can be filtered, as well. (On the right side of each subpage, click “All” in the States field to deselect all states, and then select the state or states of interest.)
Statistics on child injuries are also important, but detailed data on injuries is less available, and injury data is collected as a representative sample (not a census, in which every instance is recorded). But NHTSA’s National Center for Statistical Analysis (NCSA) has many additional sources of information, including injury data. (Warning: A data lover could spend hours looking over these pages!)
Also, see the related article below for further information about linking injury data from two sources—hospital discharge records and crash scene reports—to greatly improve the quality of crash injury data.
Data about the solution
Developing the CPS field and training certified CPSTs has been a major step in solving the problem of child crash injuries and deaths, so data about CPSTs’ numbers, locations, skill sets, etc., can be useful for managing programs. Safe Kids Worldwide, the technician program’s certifying body, provides a national snapshot of this information on its homepage. The site charts the total number of instructors/instructor candidates/techs, as well as the number of new techs added in the calendar year, the number of courses completed and offered, and the number of techs with extra training (special needs and school bus).
Another resource, found on the National CPS Board site, is a set of state-specific pages that indicate the number of techs and instructors by county along with heat maps of this information to illustrate the geographical concentrations of techs within each state. The data was compiled in early 2020, and while it might still be useful today, no routine update mechanism has been established, so it will not remain current. However, Safe Kids Worldwide reports that an updated workforce analysis, which may provide similar information, is on that organization’s radar. In the meantime, contact state CPS coordinators for current data on where CPSTs are located.
Data about progress
Each interaction with caregivers is an opportunity to educate—and also a data collection point. CPSTs have kept documentation about checkups since the CPS program began, but the value of this data has increased dramatically since the digital check form was implemented a few years ago. The National Digital Car Seat Check Form (NDCF) was updated in early October and is now in version 7.0. Besides providing a modern, paperless way to document seat checks, the NDCF is an important tool for compiling data from those checkups about the progress of CPS efforts, as expressed by CR use and misuse statistics.
At press time, the NDCF had collected data from 99,847 checkups—just shy of the NDCF Team’s goal of 100,000 by the end of 2022. This year, 27,577 checks were recorded through August, putting 2022 on track to a solid year-over-year increase from 2021. This growth is important because the statistics drawn from this information are more meaningful when they’re based on a large sample size.
Members of the NDCF team analyze the data gathered by techs to populate the National Data Dashboard, which the public can view at www.carseatcheckform.org. It contains information about overall CR use and misuse, as well as about various subcategories.
The dashboard and table tool for filtering information on the site make valuable CPS statistics readily available to NDCF users and nonusers alike. In addition, an NDCF user or group (team, coalition, state, etc.) leader can access and manipulate their own dashboard and raw data, as needed. Therefore, the ability to use NDCF checkup data to meet a specific user’s needs is practically limitless.
Linking Injury Data Creates a More Complete Picture
When studying crash-related topics, many researchers and public health professionals rely on one of two sources: reports filed by officers responding to crash scenes and hospital discharge records. However, each of these sources has limitations. For example, hospital discharge records do not include information from the crash scene that may be associated with injury (such as seat belt use) and may overlook minor injuries for which no medical care was sought. On the other hand, crash report data typically classifies injuries in broad categories and may miss injuries that must be diagnosed in a clinical setting (such as concussion).
While these discrepancies are known anecdotally, the Center for Injury Research and Prevention (CIRP) at Children’s Hospital of Philadelphia sought to scientifically establish their extent. Using the New Jersey Safety and Health Outcomes Data Warehouse, which integrates the two data sources, CIRP researchers studied how much of the entire crash-injured population gets captured by each of the two resources. Overall figures were considered, as well as age, race/ethnicity, gender, injury severity, and road user type.
The researchers found that, of over 260,000 injured crash victims in the database during the 2016-2017 study period, hospital discharge data and officer-reported crash data separately captured only about two-thirds of the injured individuals. Therefore, research that uses nonintegrated data (the norm) may miss over one-third of crash injuries. Compared with officer-reported crash data, hospital discharge data captured a larger share of individuals who were over age 65 and/or were Black or Hispanic. The hospital discharge data also reflected higher severity injuries and was more likely to record bicyclists and motorcyclists.
The study concluded that there is significant value in integrating data in the other states to reflect the true incidence of crash-related injuries and inform mitigation efforts in an unbiased way.
Reference: Lombardi, L.R. et al. “Improving identification of crash injuries: Statewide integration of hospital discharge and crash report data.” Traffic Injury Prevention. 2022 Jun 13:1-7. doi: 10.1080/15389588.2022.2083612. Epub ahead of print. PMID: 35696334.